There is an entire other post in my drafts folder, where I meant to lay out all things that I can do towards my Raspberry Pi weather station, to shore up my personal morale against what I can’t do. However, that post will stay in drafts or get deleted, because one of my can’ts became a can.
For reference, this is the design I’m using, although I only use the command line, and I’ve been building on Pi ZeroWs.
Power
Power is something I’ve gotten pretty good at. Using a solar panel and LiPo battery, I can run a Pi off solar energy. So far, the most I’ve gotten is about two and a half days with a 6600mah battery, but that’s with the solar panel inside at a window; supposedly they get better performance outside. I’ve also not optimized placement, and once they’re available, I plan to try a 10,000mah battery.
Sensors
I’ve gotten most of the sensors working. Digital sensors like the BME280 and the ground temp sensor are straightforward, and I’ve got working code for the anemometer.
Where things have been tricky have been with the wind vane; I’ve not really tried the rain gauge yet. The wind vane is an analog sensor, so its data must be read by an analog-digital converter, which in turn has to have data analyzed in order to produce meaningful information. There’s a bit of pfaffing about with resistors, but I’ve at least confirmed some variable data is coming in. I just need to get it sorted into something useful.
Visualization
This is where I’ve had a breakthrough, thanks to help from Jim Bennett, a regional cloud advocate for Microsoft – essentially, an evangelist for Microsoft’s developer community, with a passion for Azure IOT. After seeing him demo a sensor visualization solution using Farm Beats, I got some time with him to learn more about Azure IOT Central.
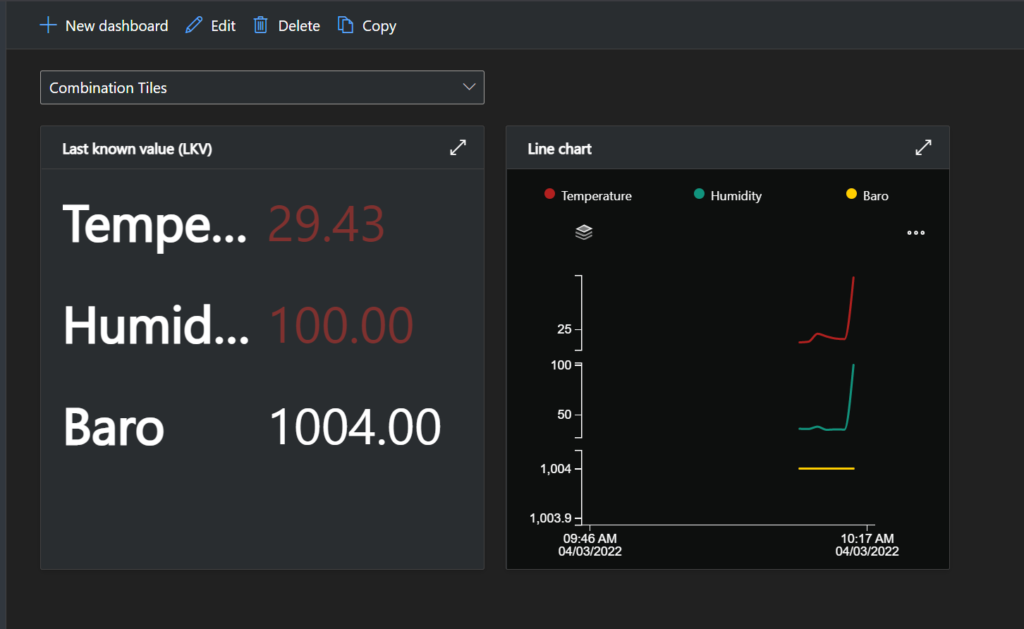
Basically, IOT Central simplifies and obfuscates a lot of what I’d been trying to do on my own with various Azure IOT tools. While I will probably circle back to “original” IOT at some point, IOT Central made it easier to start sending telemetry and display it in graphical form, like so:
Azure IOT Central (IOTC for short) is free to sign up for and has pricing for different tiers of various services. It provides a console to create apps, connect devices, and ingest telemetry; a lot of things I’m used to doing in Azure can be done from IOTC, such as triggering alerts or Power Automate flows, exporting data, or – most importantly to me, showing my telemetry in a graphical form.
While I won’t screenshot my way through everything, I’ll outline the process.
First, I created an app. Initially it’s just an object that exists, for everything else to be in.
Then I had to connect my device. It’s actually a bit easier to do this by including some automated provisioning in the code, rather than adding the device manually. Once defined in the app, it needs to get added to a device group even if it’s the only device in the group; some of the configuration logic requires specifying the device group.
The code local to the pi imports the libraries for the sensors and for Azure IOT Central; I will highlight that some libraries have multiple editions, i.e. an async version and non-async version. In particular, my last bit of troubleshooting had me settle for non-async data; something I’ll change later.
After that, running the code got telemetry going, and I was able to get to the fun part. Visualizations are simply creating a new dashboard, dragging and dropping tiles in and then configuring them to show data in various formats. You can even specify what kind of data it is in most cases, i.e. temperature or pressure, and so on.
That’s it. I’m light on technical details for my project, because it’s still being developed; at some point I’ll need to set up my own GitHub rep to share. Next steps for me are to enhance my Azure telemetry story, namely to show data in a website, and also to get the wind vane working.
I’ve come a long way, I have to remind myself. Just a bit further, and some time this year I’ll be planting a weather station in a garden somewhere.