One of my longer-term side projects is to build a weather station. For starters, I belong to a kayaking club, with a boathouse on the water, and one of the chief concerns of paddlers is the weather conditions, especially wind speed and direction. Additionally, as I’ve been studying Microsoft Azure for a while now, I’ve been drawn towards IoT, or Internet of Things, and I wanted to learn about Azure IoT. Hence, the following project.
I say project but in fact this has drawn me into a series of smaller projects, enough that I’ve had to organize my work as much as I would any customer engagement. My project tasks have gone from a list of “make it do this, that, and another thing” to having specific subtasks below each of those. There is mas learning, and to help me consolidate my knowledge, I decided to write the first of what is sure to be a series of web posts on it.
The Weather Station
I am keeping things simple to start, using the Raspberry Pi platform coupled with a BME280 sensor. The latter doesn’t do wind, but it’s among the starter-level sensors that hobbyists use, and is explicitly called out in the tutorials I started with.
I’m not going to detail the Pi build. Raspberry Pi-based weather stations are common and easily looked up. Most use Python, and almost all are local-only. That is, they read sensor data and display it on something the Pi is attached to, whether a full display or a smaller LED display. The tutorials I follow lean on node.js, so that’s what I ended up using.
I’ve set aside a Raspberry Pi 3B+ as my build box, using a breadboard for now to connect to the BME280. Initially I ran simulated data until I soldered the headers on the BME280. Eventually I’ll build a production model based on a Raspberry Pi ZeroW.
Pi-o-T: Sending data to the Cloud
My own goal has been to make the data available remotely. Most Pi tutorials will have you set up a web server on the Pi itself and connect directly to the Pi, but that would require working out some networking to make it openly available. Besides, I also want to learn about Azure IoT, so I found and followed these tutorials:
Basically, I’m going to use two Node.js applications. One sits on the Pi and reads data from the sensor, and then transmits that to an Azure IoT hub. The other is a web app (think “web server”) that will read that data and present it in a visual format. There are a few intermediate objects that get created along the way, but that’s the gist: Read and transmit data, receive and present data.
Let’s look at the first one.
On the Azure side, there are some pretty basic steps: Create an IoT hub, and within that hub create a device. This device is the Azure counterpart to the Pi.
An IoT hub can be home to multiple devices and services to go along with them; this is a bit overkill as there are several services I won’t be using, but if I wanted to I could host some analytics, multiple devices, as well as configurations for devices if I want to remotely configure them automagically in the future. I might , but not now, so for now the hub is just where the device lives.
The device in Azure gets paired with a device in real life. The device in Azure provides several keys, but all I really care about for this example is the primary connection string. I will need that for the Pi to be able to connect, so I’ll keep that handy.
On the Pi side, since this is my first time, I did some pretty standard out-of-box things. I inserted the noobs card that came with it to install the default Raspbian operating system, and importantly, I set up I2C and SSH.I had to install Node and get my head wrapped around what was native to Raspbian vs what required additional installation.
I set it up with my wireless network, jotted down the IP#, and from that point on I basically shelled into it using SSH in VS Code, because I only have enough decent video ports for the other three computers at my desk.
From the command line I installed and updated node.js, and then cloned the sample application. Fortunately it has a “simulated data” mode, so I was able to put off hooking up to the BME280.
When I ran the app, I had to supply the connection string to the Pi’s counterpart in IoT hub. The only hitch I ran into here was that the command has to be run in the install path; it also has to be run as a superuser (sudo). It’s an easy mistake, and there are probably better fixes, but now that I know, it’s easy to make sure I’m in /iot-hub-node-raspberrypi-client.
Presenting the data from the Cloud
At this point I had the Pi throwing (simulated) data to its counterpart in the cloud. I could monitor the messages coming in, with the built-in monitor in VS Code as well as the endpoint in Azure. The raw output looks like this, over and over:
[Device] Sending
message: {"messageId":2253,"deviceId":"Raspberry Pi
Node","temperature":22.2407900001861,"humidity":62.76274373668976}
However, there’s no presentation of that data. I could monitor it by watching the endpoint, but that’s not something I could share. Thus, on to the second tutorial.
Following the instructions, I learned what I expect are some fundamental concepts in IOT. An IOT hub is a kind of event hub; various process can read from that hub, but it needs to be organized for consumption, and aside from IOT, I had to have a web app running an application to read that data.
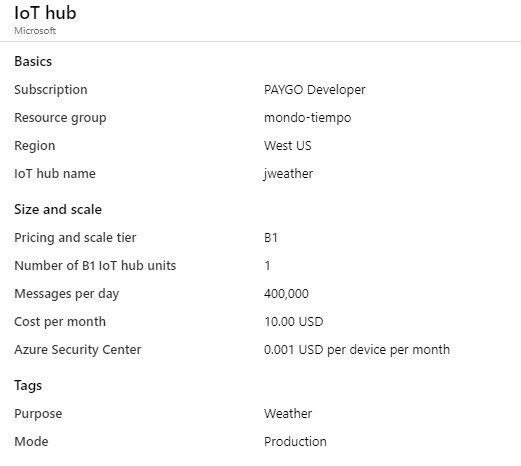
I used a free-tier F1 IOT hub for this first build; the image below is from a subsequent basic B1 tier, but otherwise summarizes an IOT hub. Remember from above, the hub is an event hub, and is where the cloud counterparts to each device are created.
Note the message per day limit. The free tier was limited to 8,000, which was an issue at first -details on that below.
In order for my web app to be able to read the telemetry coming in to the hub, I had to create a consumer group. Consumer Groups essentially structure the telemetry in a way that another service can use. For example, if I’m receiving a bunch of data, every minute, I may want to read that data as it comes in, or I may want to write it down in a database for analysis later. Since I’m trusting whoever wrote the code, I just created the consumer group, because I would need that as a value to enter into the code.
For initial testing, I ran the web app code on my Surface Pro (locally), but quickly moved to the cloud. Pretty soon, I had some (simulated) telemetry coming in:
Huzzah! Finally, success!
Challenges
I ran into a sticky wicket at one point with Node on the Pi. Whenever I would run the script, I would get an error about wiring.js. I spent a couple of days diving deep into this and found a thread on the associated kit, which eventually led me to this post. Thanks to MasonPawsey for the code example which, AFAICT turns off the LED flashing.
I also had a bit of difficulty getting the web app to run locally. Basically, because certain values such as the connection string are referenced in several places, you need to declare that as a global variable. The instructions in the tutorial assume you’re doing so in the cloud, in Azure CLI or CloudShell; I had to look up how to do this in VS Code.
Lastly, the default value in the Pi-side applicaiton polls for data every two seconds, which meant at a minimum I was sending 30x60x24 or 43,200 messages per day. Remember, I’m on the free tier, so I was blowing through my daily quota in about 5 hours. I’d accounted for that, but there were also some twin call messages that goosed that, so about every four hours, the whole thing was shutting down. The one consolation is that, since this is a free tier, it’s not like you’re charged for over-consuming. It just stops and you have to wait a day. In any case, one of my brothers is a professional HVAC guy, and he’s said that they don’t poll more than a minute or two, so I adjusted the timing and everything works now – I just have to wait a bit longer for data to come in.
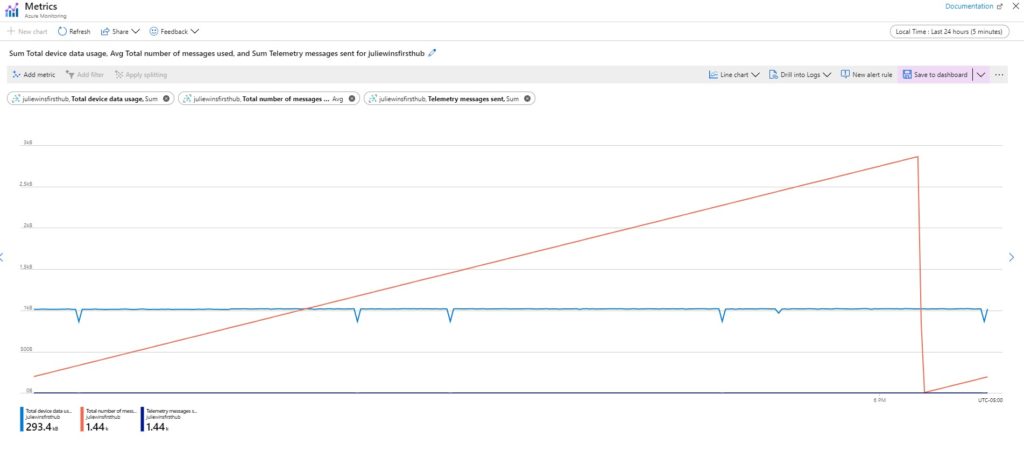
Here’s the dashboard I created. The long rising line is cumulative messages. The drop on the right is when the counter resets after 24 hours. The blue line in the middle is the size of the data; as you can see it’s pretty low.
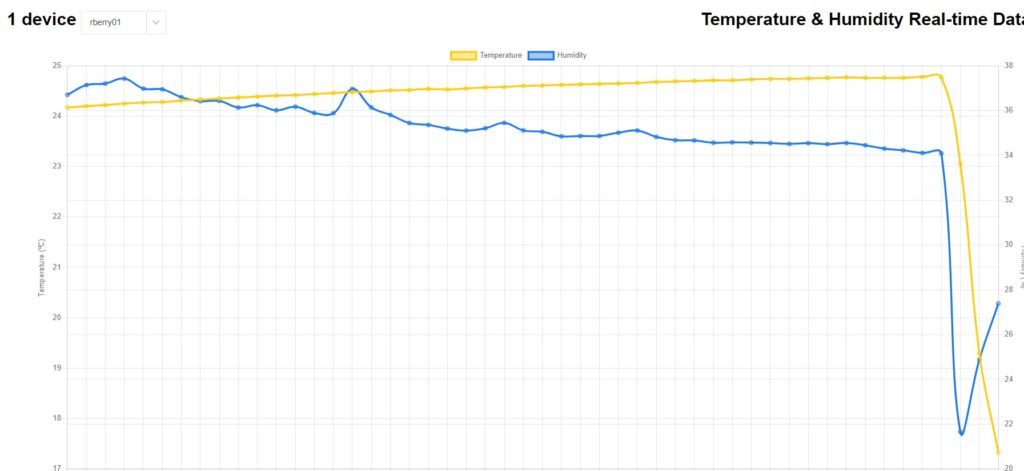
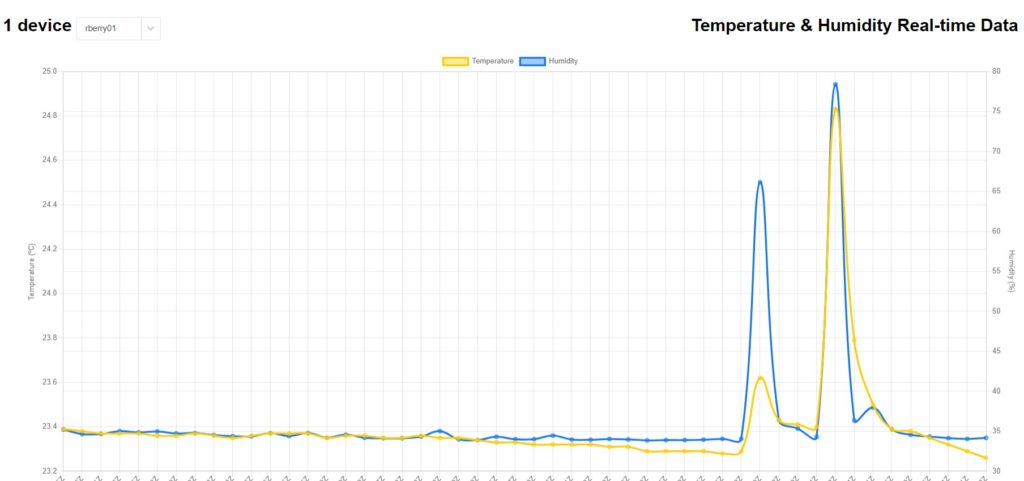
Here’s the final output, on Pi Day 2020, running on my desk.Temperature in Celsius on the left, humidity on the right, latest data is on the right. Yellow line is temperature, blue is humidity. You can toggle the lines on and off.
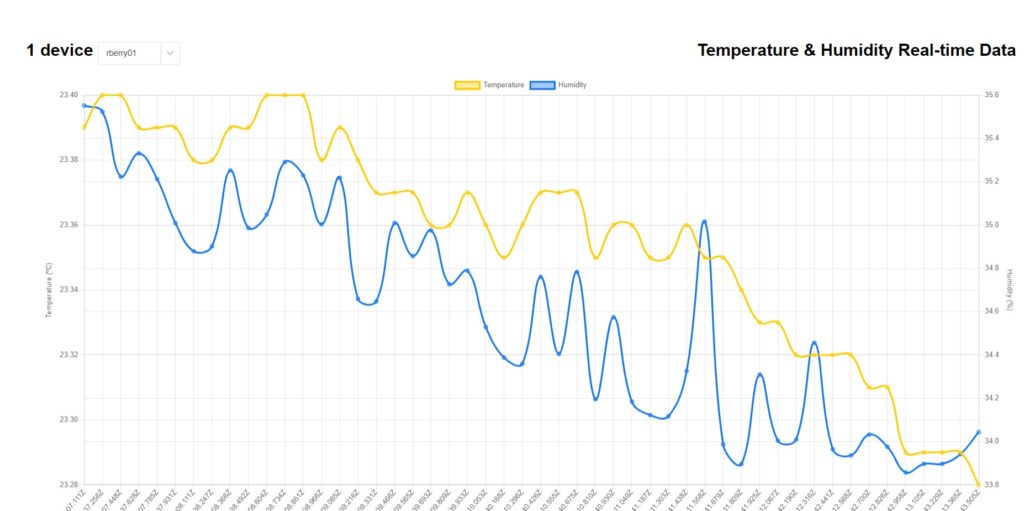
Here’s another picture. The spikes are from when I leaned over and breathed over the sensor.
Summary
Most of the above work took me about ten or twelve hours; a little over half of that was troubleshooting and reading. I soldered for the first time. Already I’m working on the next steps. I certainly learned that doing is not so simple as reading would make you think.
On my list are:
- Moving to a Pi ZeroW. The first challenge there is that the hardware doesn’t support this version of Node, so I’m effectively re-architecting the whole software side.
- Hardwiring the sensor, so I don’t have a breadboard.
- Re-designing may be to my advantage, since I want to add more sensors and telemetry, and most of those have a wealth of Python scripts available.
- Devising a presentation layer that can show more than temperature and humidity.
- Piping data into a database for analytics. In fact it might be easier to pipe all telemetry to a database that is then consumed by a web app.
- (Done) test out machine learning to predict the weather. This gets dumped as a spreadsheet in an Azure storage blob. Be sure to turn off Stream Analytics when you’re done; the ML is free but the SA is not!
1 thought on “Weather Pi in the Azure Sky (I)”